|
Quiz Statistics and Reporting
Last modified on 19 September 2023 07:10 PM
|
|
|
This article describes how instructors can use the built-in quiz statistics available for all selected-response-type questions (multiple-choice, true/false, matching, etc.) in the eClass quiz tool. These statistics are not available to review until after a quiz attempt has been completed by students. Once available, the stats can be used to review the performance of the class and to help determine the validity of the assessment and specific questions. Test Scoring and Questionnaire Services (TSQS) can provide instructors with alternative item analysis reports and exam files using eClass quiz data. The reports may be of interest to instructors who have transitioned to eClass exams from Scantron multiple choice exams and would prefer to see the TSQS-style exam reports. Instructors can request reports by emailing test.scoring@ualberta.ca. Contents:
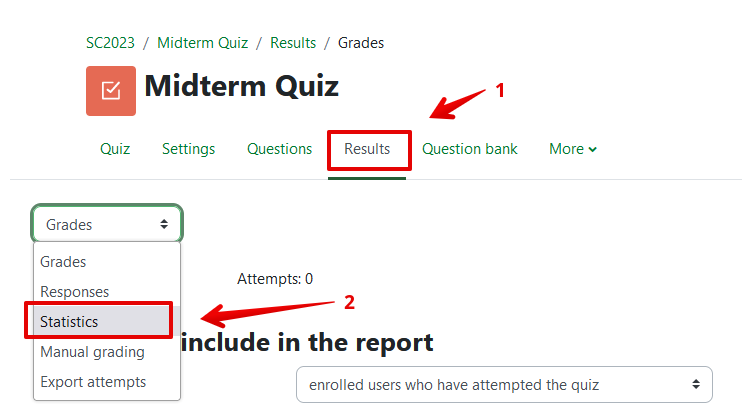
Navigate to your course home page, and click the link to your Quiz.
On the quiz details page, Click Results, then from the dropdown menu, select Statistics.
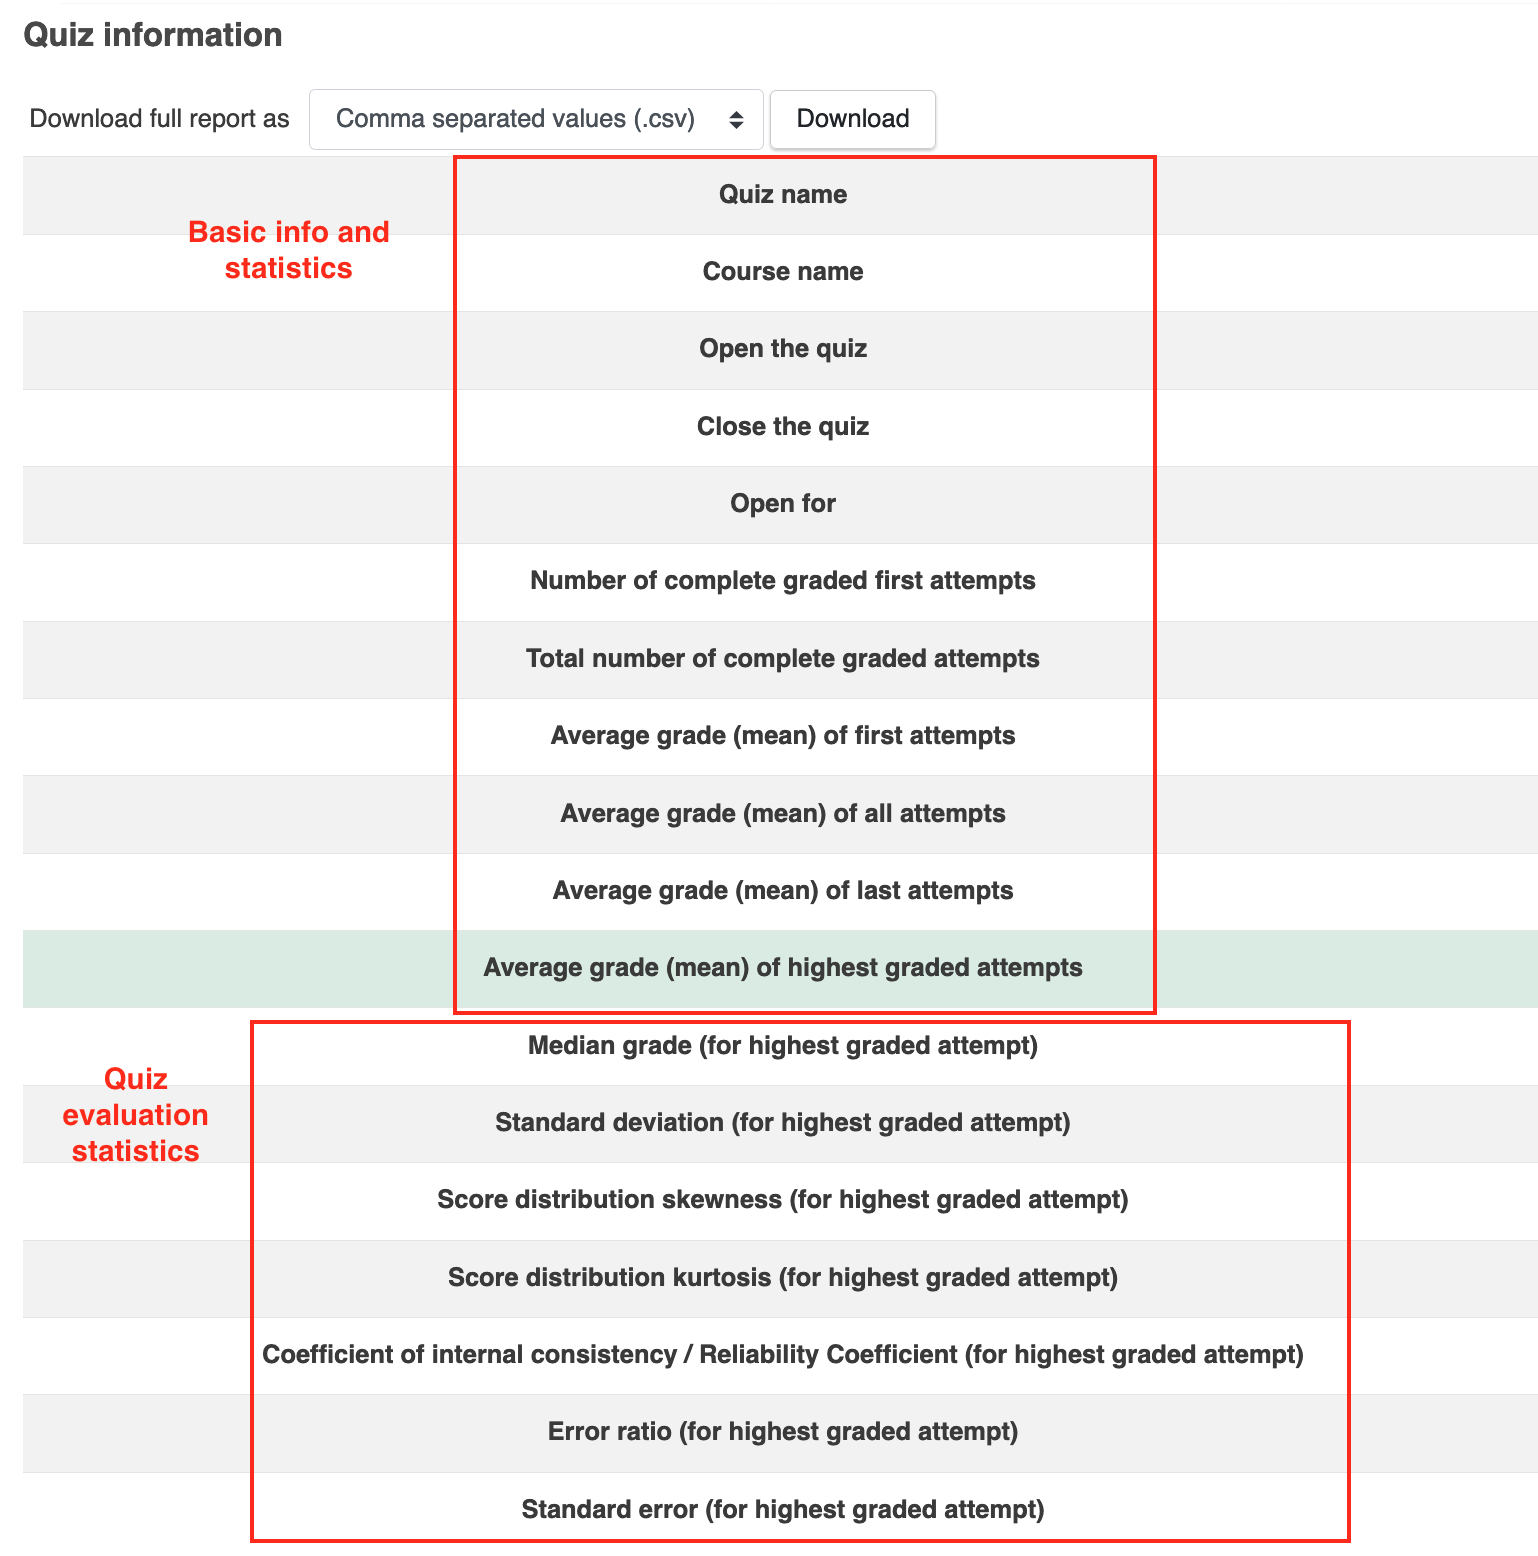
The statistics page sometimes loads slowly in quizzes with a large number of questions and student attempts. Once the page loads, the top section displays a range of information and statistics about the quiz as a whole:
Basic Quiz Information and Statistics The first few items are basic information about the quiz and how it was delivered: - Quiz name - pulled directly from the quiz settings, the title you gave your quiz - Course name - your course name - Open the quiz - pulled directly from the quiz settings, the date you set the quiz to open - Close the quiz - pulled directly from the quiz settings, the date you set the quiz to close - Open for - pulled directly from the quiz settings, the duration of your exam window - Number of complete graded first attempts - the number of students who completed a first attempt of your quiz Depending on the parameters set for the quiz regarding how many student attempts can be made (one attempt only, multiple attempts, highest grade, etc.), the following items will indicate the average grade across attempts: - Total number of complete graded attempts - total number of student attempts on this quiz - Average grade of first attempts - Average grade for all attempts - Average grade of last attempts - Average grade of highest-graded attempts
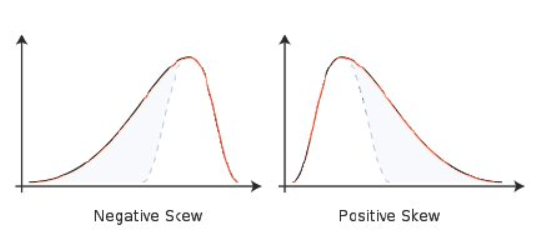
The next few items can help to determine the validity of your assessment overall. - Median grade (for highest graded attempt) - If your quiz has skewness (by having a number of very high or very low scores), the median will assist you to judge your class’ performance in comparison to the mean (Average grade of attempts). - Standard deviation (for highest graded attempt) - The standard deviation indicates how spread out the grades are in comparison to the average. Larger standard deviations indicate more spread and smaller standard deviations indicate less spread. - Score distribution skewness (for highest graded attempt) - Skewness helps determine how symmetric the distribution of grades is. Zero implies a perfectly symmetrical distribution, positive values have a ‘tail’ to the right and negative values have a ‘tail’ to the left. The ideal number will be a negative number around -1.0. If the value is too negative, this indicates the clustering of grades at the top of the distribution which makes it harder to discriminate the performance of high-scoring students. Similarly, a large positive value (greater than 1.0) indicates clustering to the bottom of the distribution making it hard to discriminate the performance of students with lower scores.
Image Source: Quiz report statistics - MoodleDocs. (2020). Retrieved 10 June 2020. - Score distribution kurtosis (for highest graded attempt) - The ideal range will be between 0 to 1. - Coefficient of internal consistency (for highest graded attempt) - This is Cronbach’s alpha. Ideal values should be above 65% but anything over 80% is very good. This value is typically represented in item analysis as a decimal value ranging from 0-1. High values signify that the quiz has a high level of reliability indicating scores can be used to consistently rank students. A low value can indicate that some of the questions are not measuring the same underlying knowledge and skills as the rest of the test. In this case, reporting total scores might mask the strengths and weaknesses students have for the different types of knowledge and skills being assessed. It can also mean that the test contains questions that are susceptible to random error and thus how students' scores on some questions are not related to the intended focus of the test (e.g.: it is testing reading comprehension rather than content - i.e. the test questions are heterogeneous.) - Error ratio (for highest graded attempt) - The Error ratio should have a lower score - if this score is high, it may indicate you have several difficult or very easy questions. Values over 50% indicate that there is substantial error, and imply that less than half the standard deviation is due to differences in ability and the rest is due to chance. - Standard error (for highest graded attempt) - Standard error is derived from the quiz’s standard deviation and error ratio values. Ideally, this score should be below 8%. It is difficult to get this value below 5% or 6%.
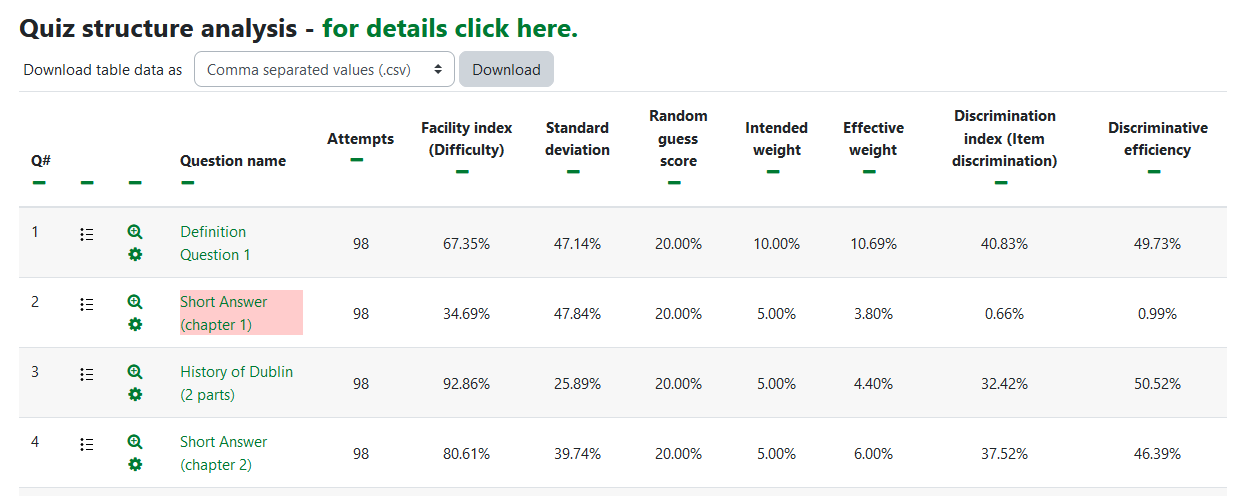
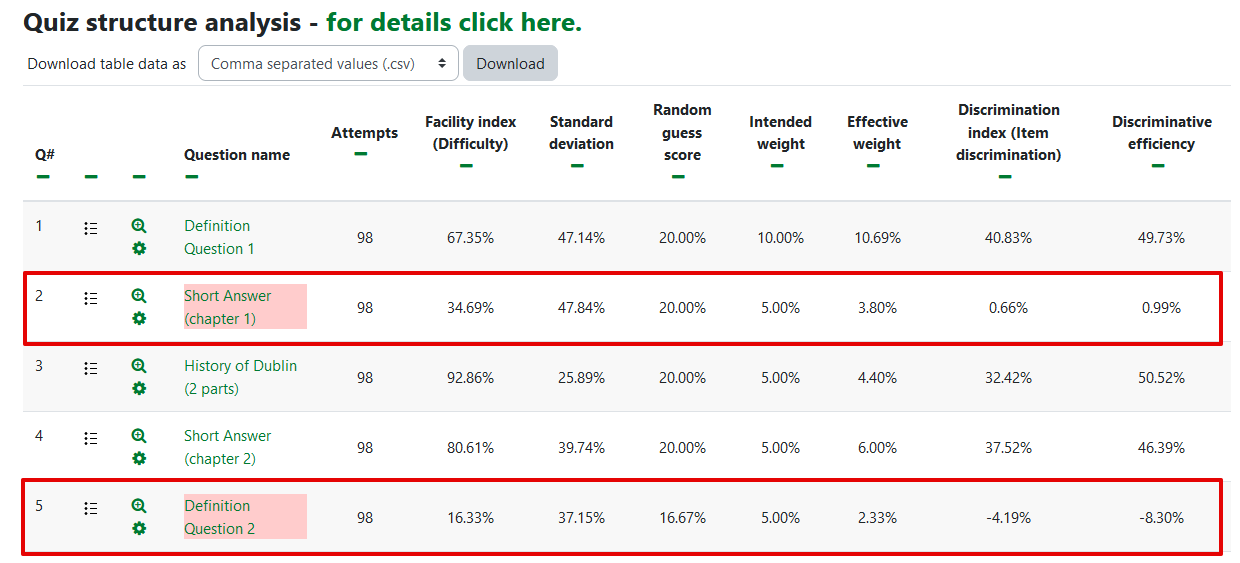
Quiz Statistics for the individual items As you scroll downwards, you will see the individual questions listed, with each question title linking to more detailed information about that question. The columns in this table provide a statistical evaluation of each question. (To see Moodle’s guide to the item analysis headings, click the link 'Quiz structure analysis - for details click here'.) If you have pulled random questions from categories into your quiz, there is information for the question number slots and for the individual items.
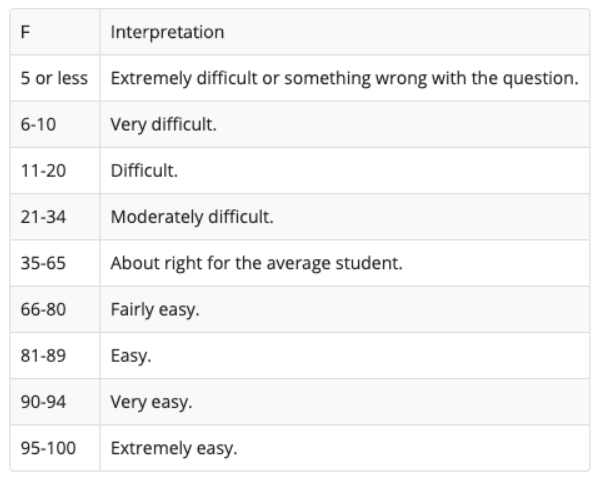
- Question name: The name of the question that was assigned when the quiz was built - Attempts: The number of students who received this question on their exam. In the event that you have randomized questions pulling from a question bank category, not all students who wrote the test may have received that specific item. - Facility Index: Also, item difficulty. This value indicates the percentage of students who answered this question correctly. You can use the following guide for an idea of the interpretation of different Facility Index scores.
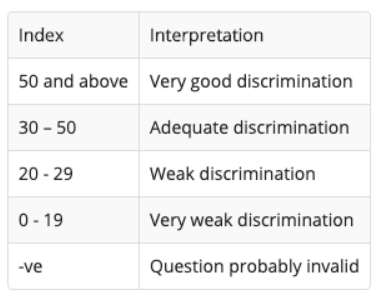
Image Source: Quiz report statistics - MoodleDocs. (2020). Retrieved 10 June 2020. - Standard deviation: The amount of variation amongst student scores for this question. - Random guess score: This is the mean score students would be expected to get for a random guess at the question. In an item with 4 answer options, students would always have a 25% chance of getting the item right. - Intended weight: The weight assigned to the question on the Edit Quiz page. - Effective weight: Is an attempt to estimate, from the results, how much of the actual variation amongst student responses was due to this question. Ideally the effective weights should be close or match to the intended weights. - Discrimination Index: The correlation between the score for this question and the score for the entire quiz, effectively Item Discrimination. In Moodle, it is reported as a percentage, while it is commonly indicated in item analysis as a decimal value ranging from -1 to 1. Low values, below 20% and negative values indicate the item is discriminating in a way that is opposite to the rest of the test. In other words, lower-scoring students have a better chance of getting these questions correct than higher-scoring students and vice versa. The discrimination index correlates students’ overall performance on the quiz to their performance on each item; stronger students should have a better chance of getting each individual question correct, and weaker students should have a lower chance of getting each item correct. If everyone is getting it right (or wrong), then the question is too easy (or too hard). The higher the discrimination index, the better the question is at differentiating students who know the concepts being tested from those who don’t.
Image Source: Quiz report statistics - MoodleDocs. (2020). Retrieved 10 June 2020. Discriminative efficiency: An item which is very easy or very difficult cannot discriminate between students of different ability levels, because most students will get the same score on that question. Discrimination efficiency will very rarely approach 100%, but values in excess of 50% should be achievable. Lower values indicate that the question is not nearly as effective at discriminating between students of different ability levels and is therefore not a particularly good question.
Some question names will be highlighted in red, which is eClass' way of indicating that these questions should be reviewed by instructional staff. The red flags are triggered by a low discriminative efficiency score:
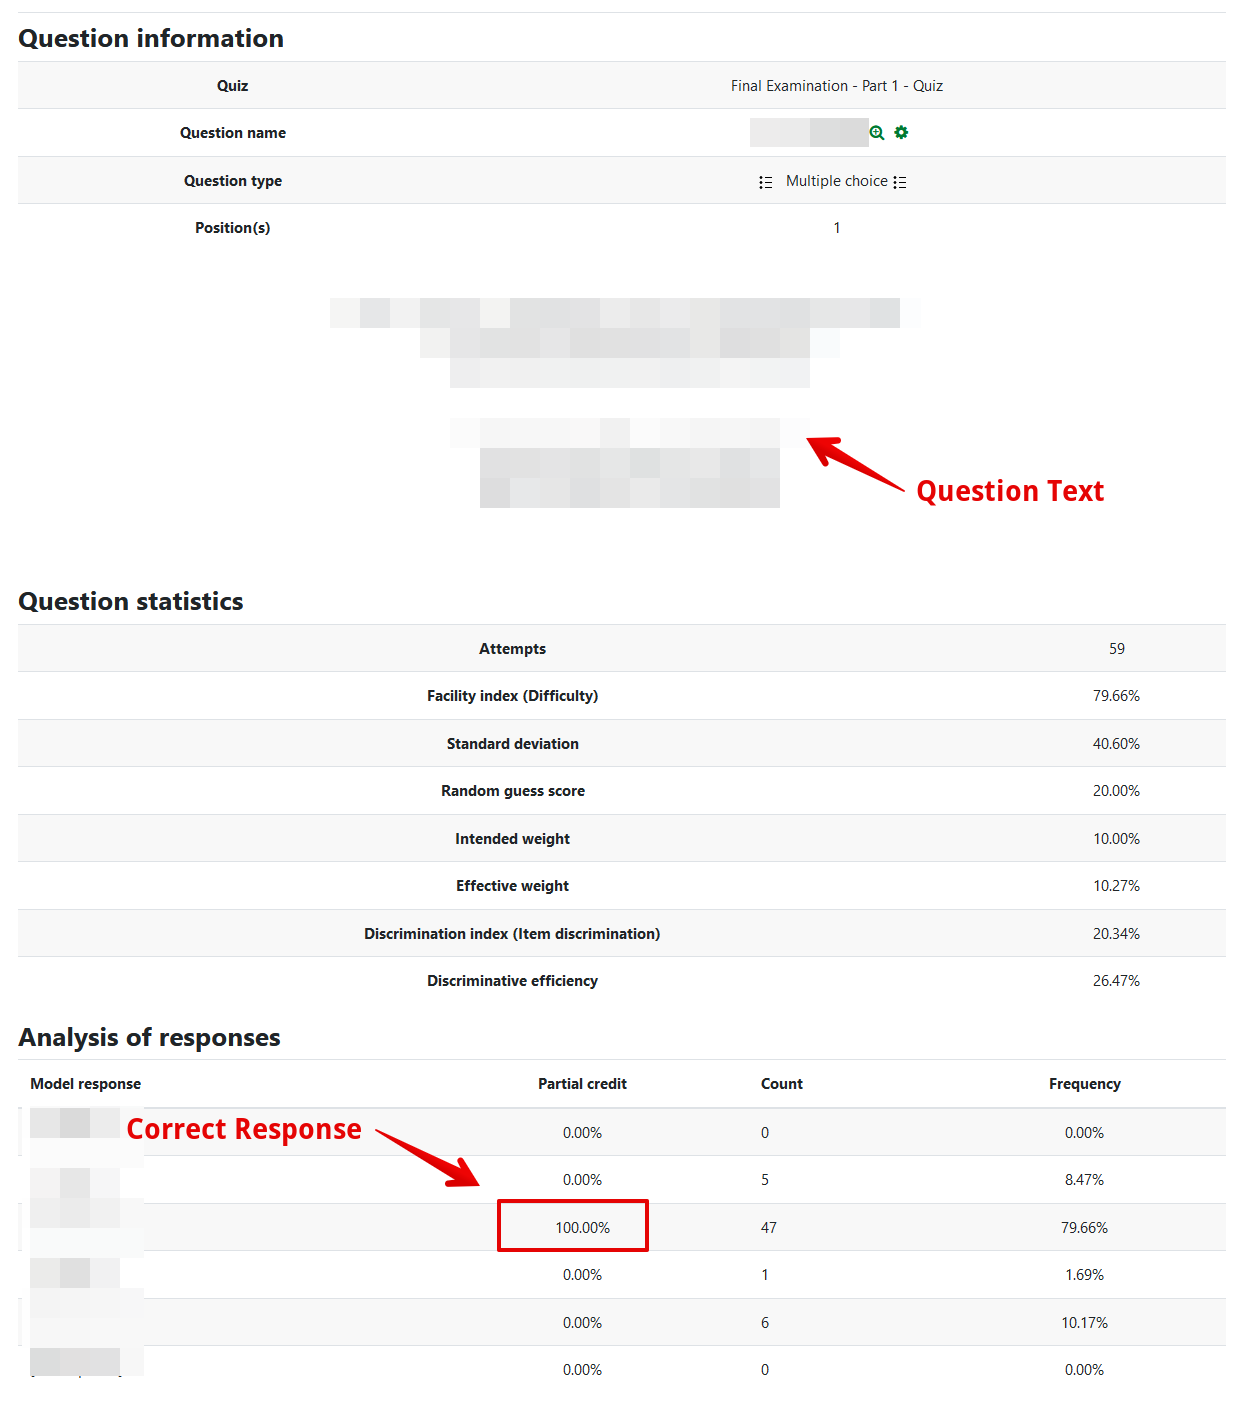
Individual Question Detailed Statistics Clicking on an individual question name will bring you to a new page with more details about the question's performance. Additionally, you will be able to see the number of students who selected each answer option to review how your distractors are functioning.
| |
|
|

Comments (0)