NOTICE: Please be advised that the content of this article may only be relevant for users concluding the final stages of course work on eClass or for users on the eClass External system. The eClass Learning Management System is currently in a read-only state that prohibits new courses, enrollments, and users from being added to the site. Credit courses and co-curricular courses at the UofA are now being delivered on Canvas, and full articles on how to use Canvas can be found here.
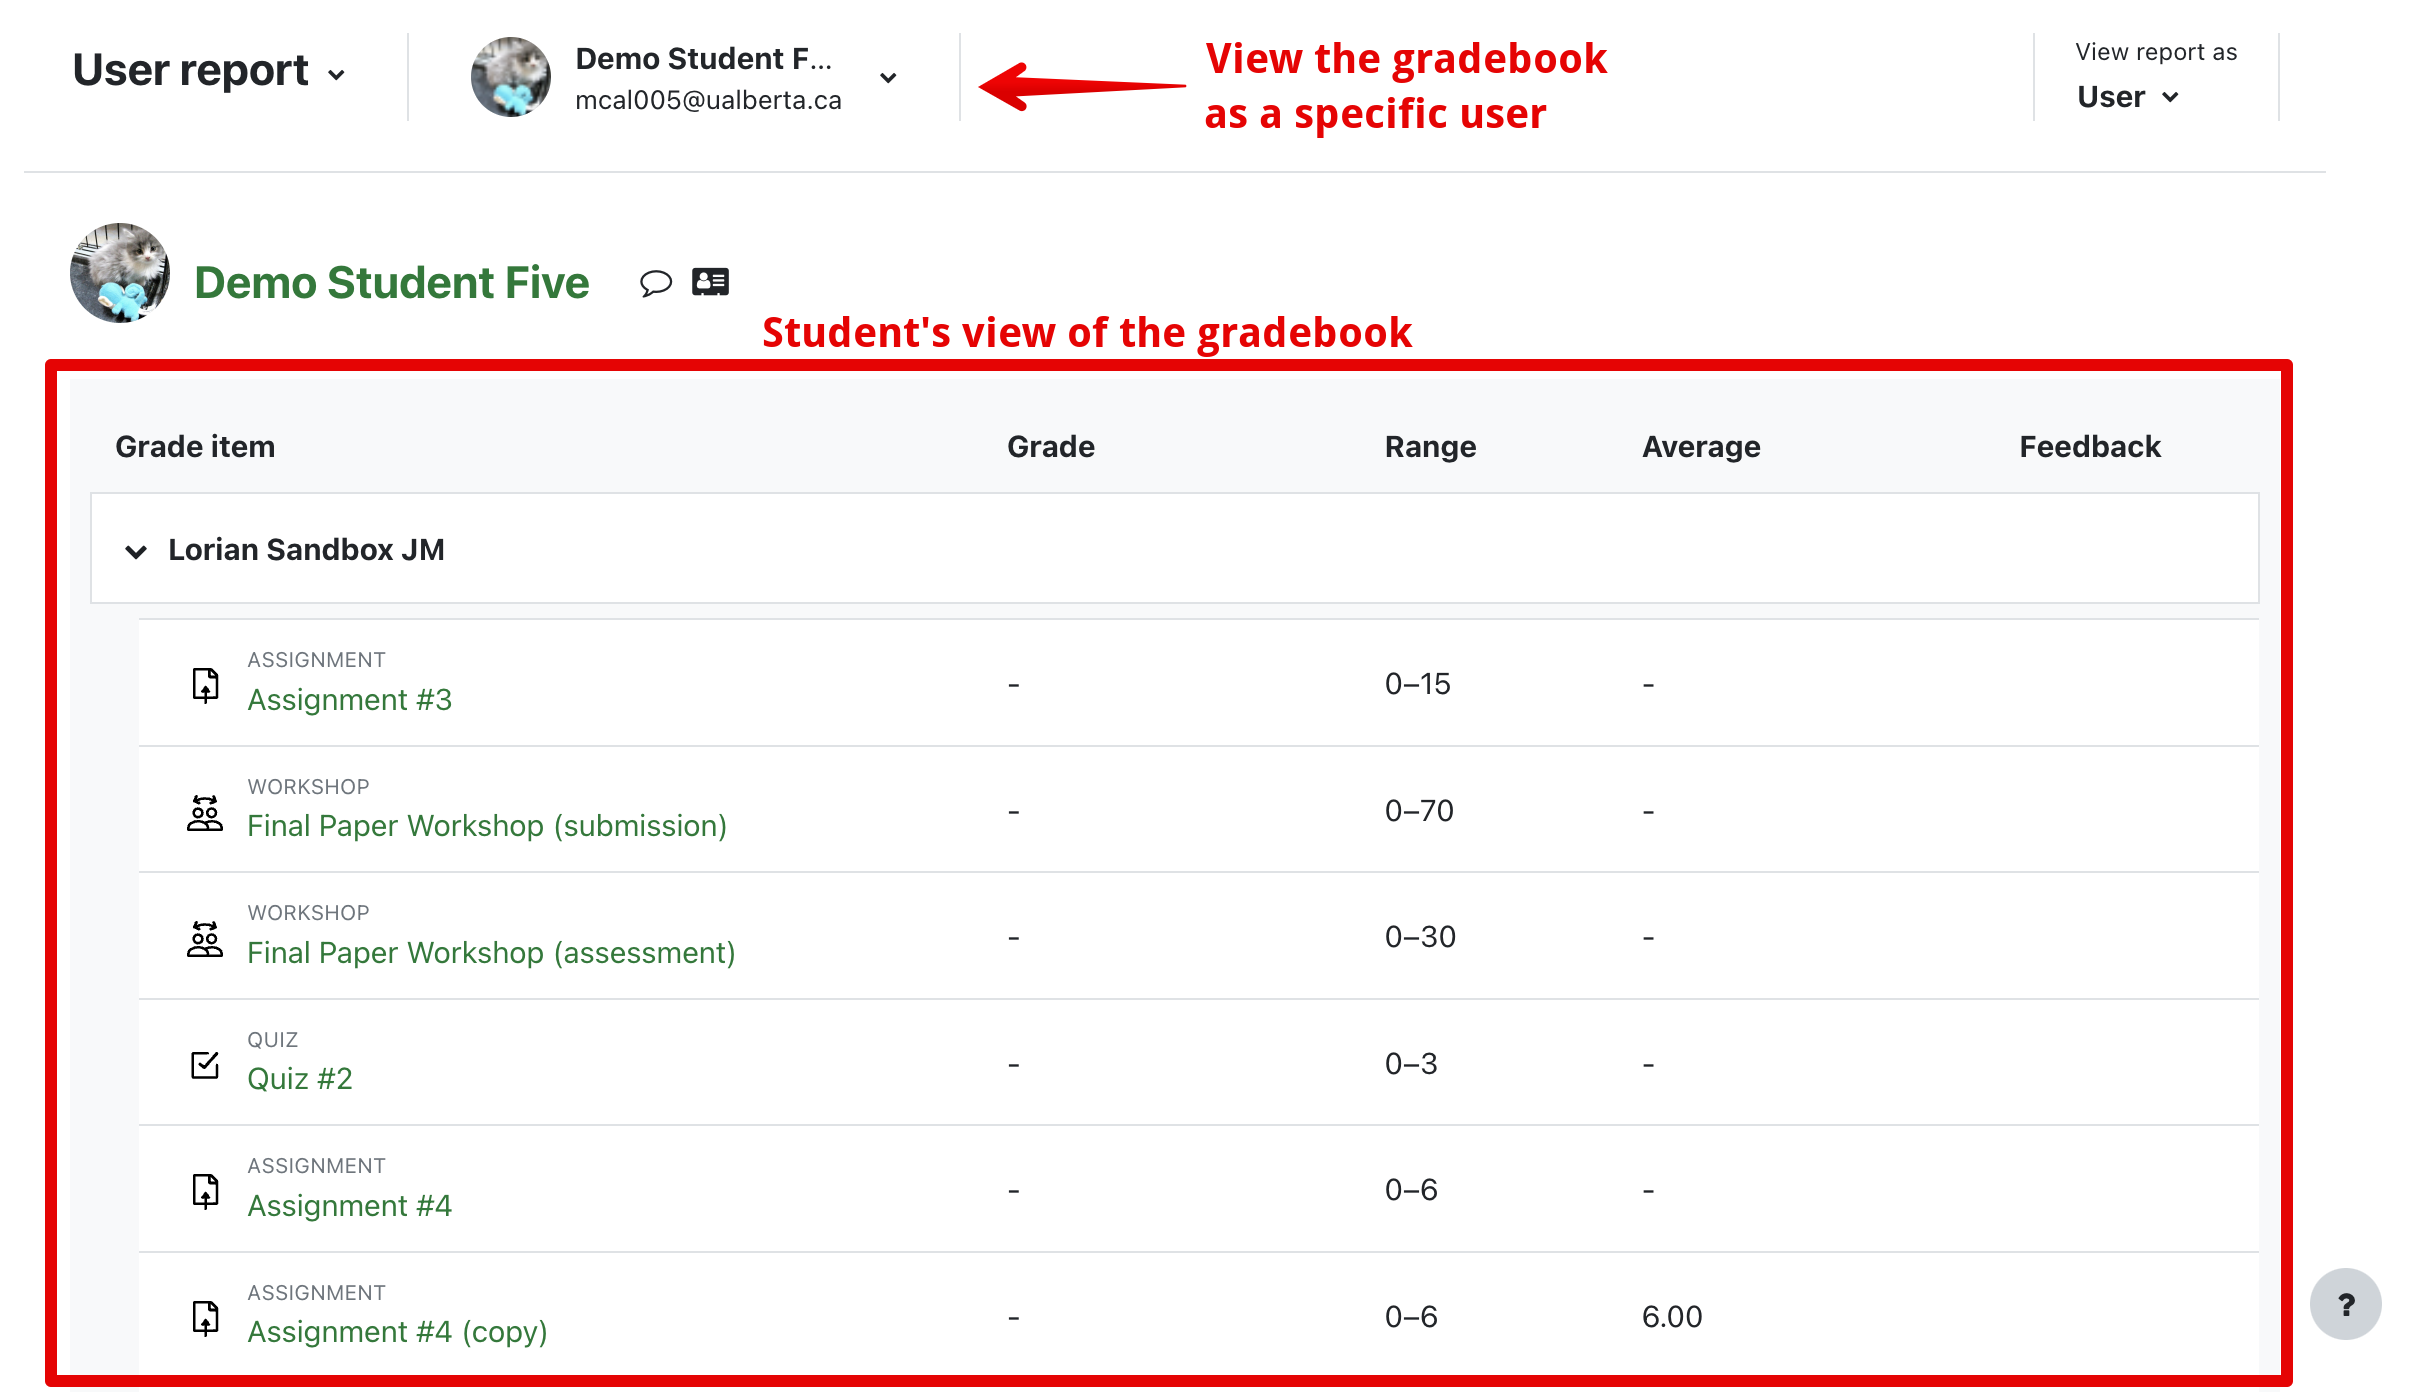
There are a number of additional columns and settings which can be used to modify what students see when they look at their grades. The student view of the grade book can be viewed under User report in the gradebook.
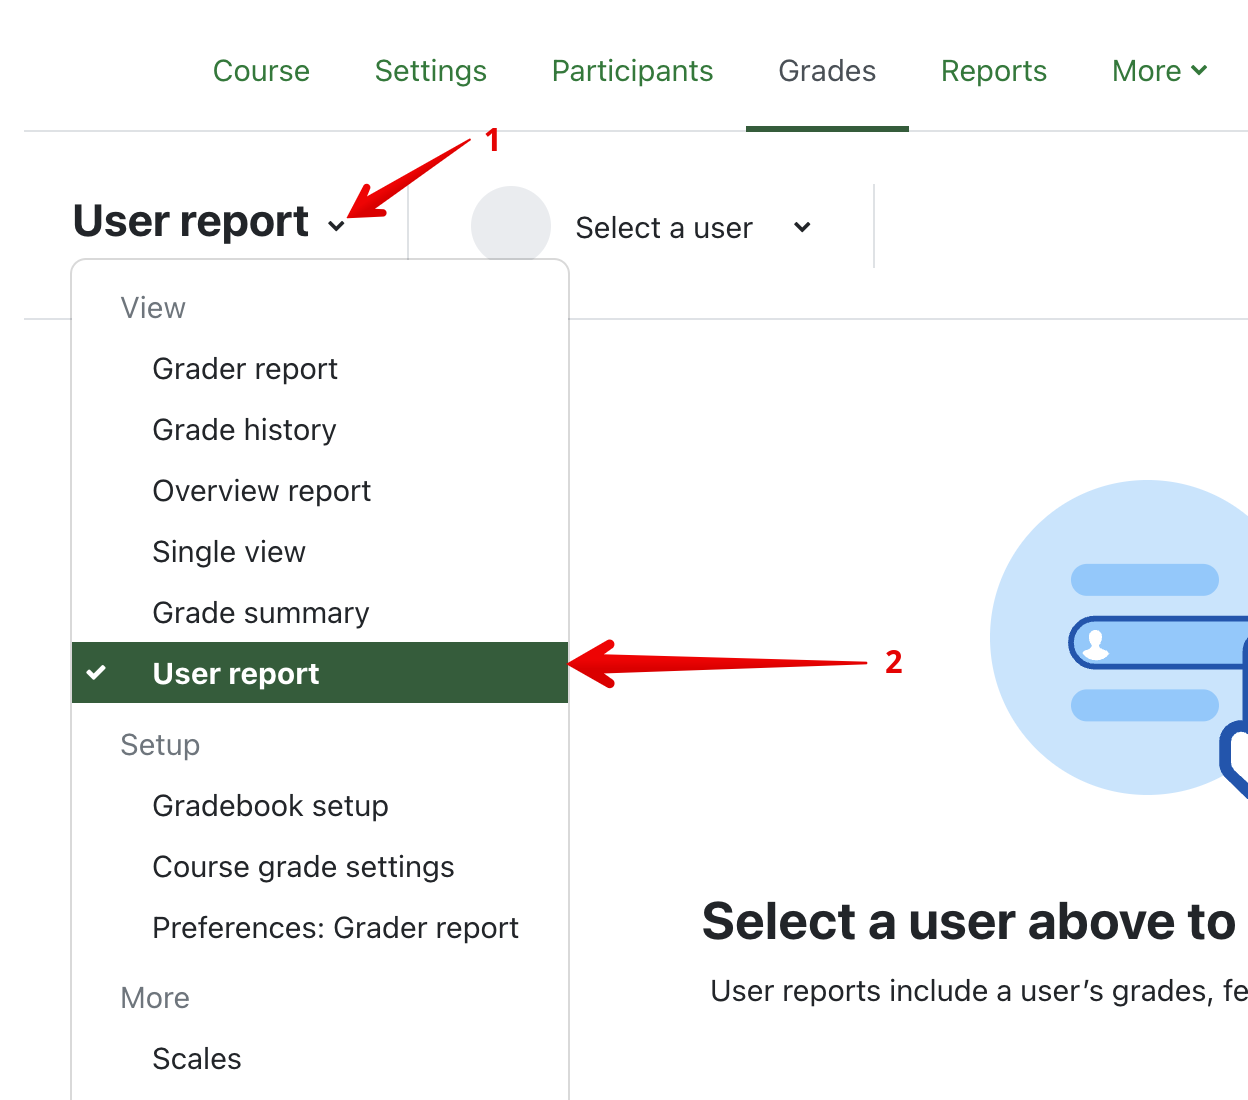
To access the User report:
- Select Grades from the top menu bar

- Select the menu option shown below and then User report.

- Select a user from the drop down menu to see the Student's view of the gradebook.

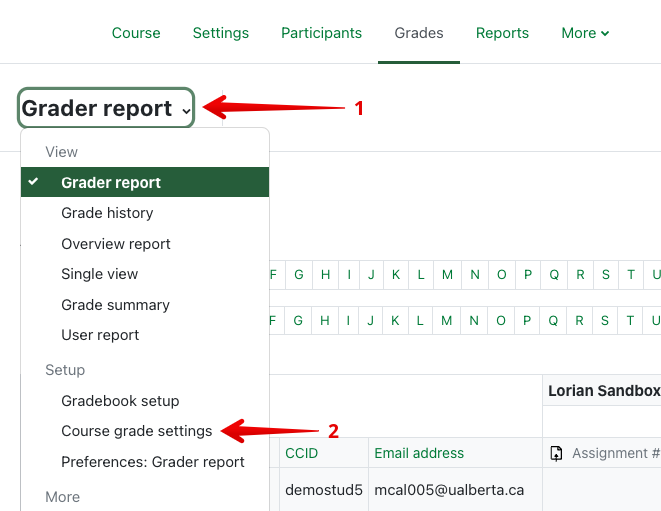
To modify the User report:
Select the menu item as seen below and then Course grade settings .
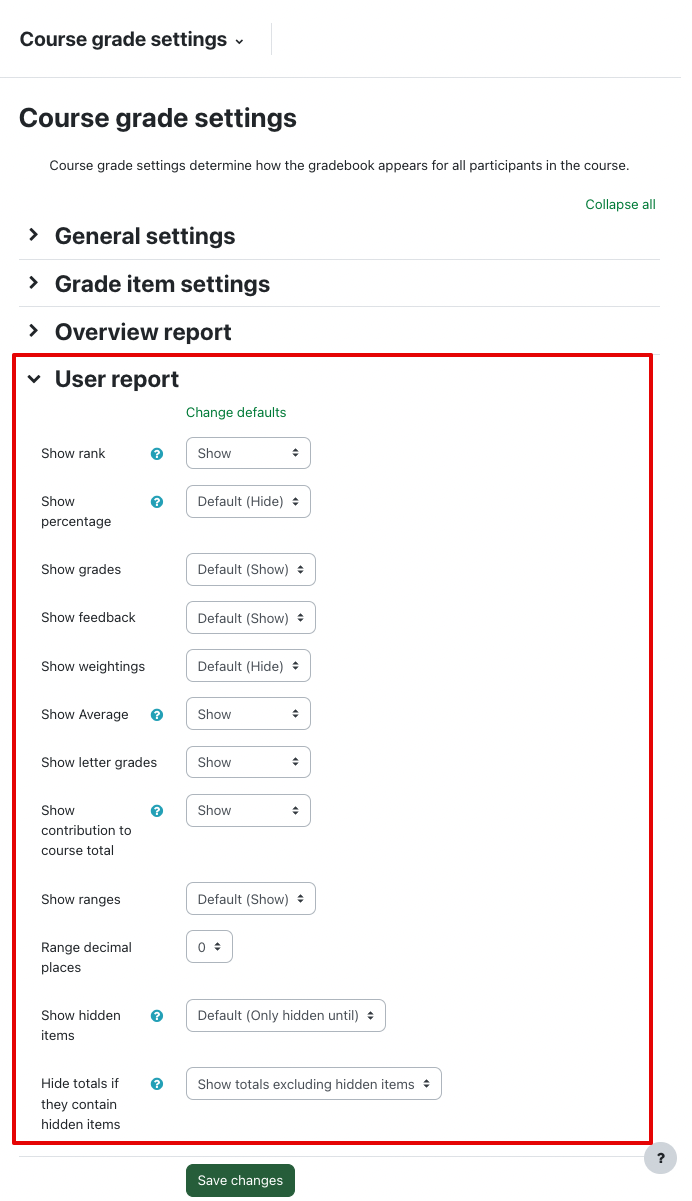
You can modify the last category of settings which corresponds to the User report. Do not forget to click Save changes once you are done.
Note: Students can only view their own grades in the gradebook and will never be able to see other students’ grades.


The default settings for the User report reflect the most commonly used settings for university level courses. Depending on your department or faculty’s regulations, revealing some of these fields to students may be inappropriate in a university level setting. For example, displaying a student’s rank and the average grade in a small class could help students to infer information about classmates’ grades.
There are some settings which can help to communicate to students how their course total grade is calculated and provide other useful information:
- Show percentage - Column for the percentage grade received.
- Show grades - Column for the raw score received.
- Show feedback - Column for feedback comments associated with a grade.
Show weightings - Column for the relative weight of each grade item. Note that this setting will exclude the weights of empty grade items if your aggregation is setup to exclude empty grade items.
- Show Average - Column for the class average on a grade item.
- Show ranges - Column for displaying the minimum and maximum attainable raw scores.
Additional (less commonly utilized) customization options are as follows:
- Show rank - Column for rank relative to the rest of the class.
- Show letter grades - Column for the letter grade equivalent of a student’s score according to the course’s Letter Grade Boundaries.
- Show contribution to course total - Column of percentages corresponding to the percentage a student’s score on any given grade item contributes to their final mark. The sum of these values is the student’s current course total percentage.
- Range decimal points - How many decimal points should be displayed in the Range column.
- Show hidden items - Sets the behavior and visibility of hidden grade items.
- Hide totals if they contain hidden items - This setting is used to prevent student confusion when grade items in a category are hidden. By default, any category containing hidden items will also hide the category total. If this setting is changed, it can be configured to show either the grade total including the hidden items or the grade total excluding the hidden items.

| 


