|
Analysing Content Usage in Your Course
Last modified on 05 July 2023 05:25 PM
|
|
|
Contents:
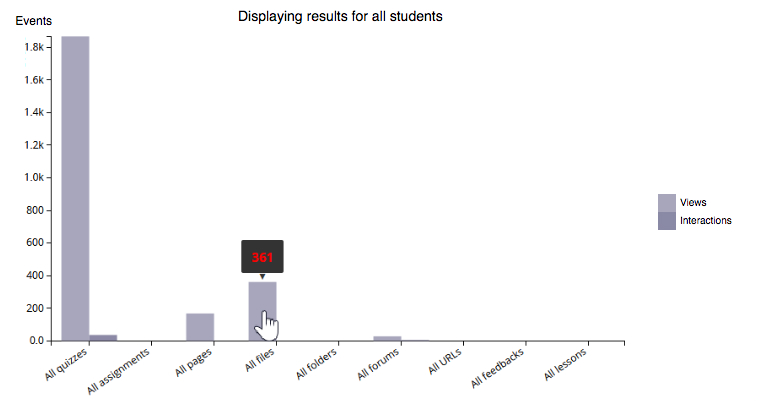
Note that not all activities in eClass are created equal -- some activity types (quizzes in particular) tend to generate significantly more events in the logs than others (ie. as every quiz question gets saved during an attempt.) The resulting differences in overall data points is discrepancy is unavoidable as the advanced usage plugin makes use of the regular eClass system logs which are also used for auditing purposes and investigations into performance. For content analyses, it makes the most sense to focus on resources instead of activities. In the sample course depicted above, the basic engagement report shows that a number of quizzes, pages, files, and forums were all accessed - this result can be refined to include only static content. By placing the mouse cursor over the 'All files' bar in the graph, the icon will change to a hand icon and clicking here will cause a new usage query to be issued, narrowing the data to include only files. The resulting graph is shown below (with the file names blurred). Note that this same process of clicking on graph bars could be used to do deeper investigation of any of the overall activities or resources.
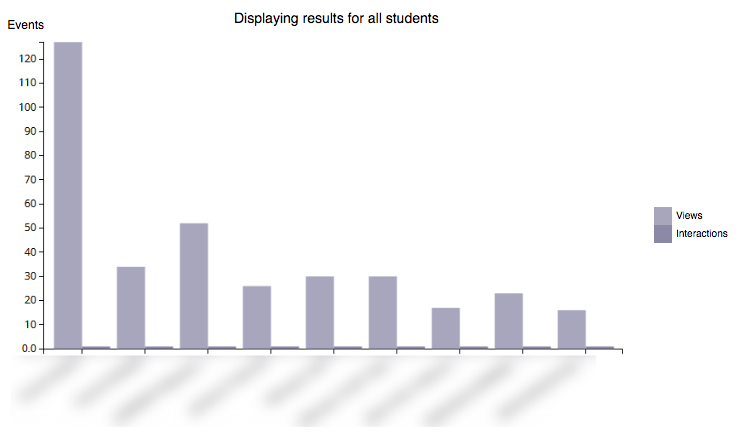
The most frequently accessed document happens to be the course outline/syllabus as we might expect. The files are listed in the order in which they appear on the course page so we can see that documents continued to be accessed as the course progressed. In this case, many of the files are similar (think weekly versions of each lecture to print off), but the overall level of access is higher earlier in the course relative to later in the course. The third document in particular seems to be also accessed at about double the average level of the others.
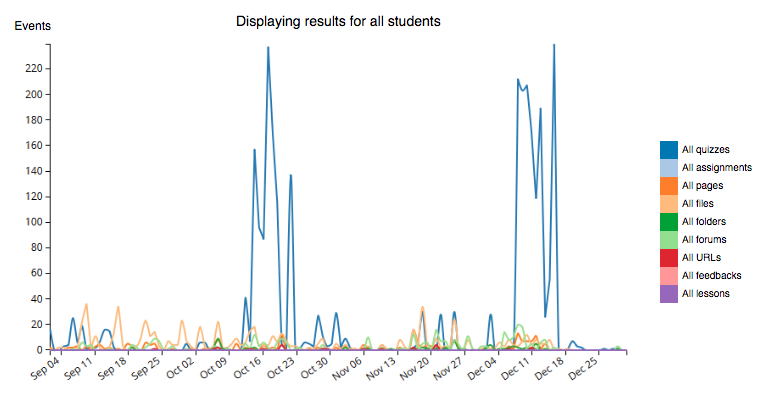
In general, the information visible here should correlate well with what the data that you receive other means (for example: informally in class). If there is an exception - why do you think it is different? Digging Deeper into Patterns of Content Usage A similar approach can be used to examine content usage over time: beginning by surveying all content types in the course, prior to zooming in on specific ones to gain further insights. Begin by adding an unfiltered Engagement over time report to your analytics page by selecting that report and pressing Apply filter (adjusting the dates if needed) - check the article Viewing a Report of Content Engagement Over Time for more details on doing this. In the sample graph below, we have also increased the Granularity to 128 (under Advanced filters) to get roughly one data point for each day in the course.
In this particular case, the focus is the weekly content pages in the course - filter the results to show only these by clicking All pages on the legend.
Notice that for some weeks, the weekly page is mostly localized in time and viewed primarily on the week it was assigned. For other weeks, however, the results are more spread in time. More Questions for consideration
In each case, the answers will hopefully match up with what you would expect based on the difficulty or the nature of the content. If not, perhaps it’s a good idea to revisit that content, ask your students for feedback, and update it accordingly. | |
|
|