|
Tracking Specific Student Behaviour in Your Course
Last modified on 20 June 2023 04:46 PM
|
|
|
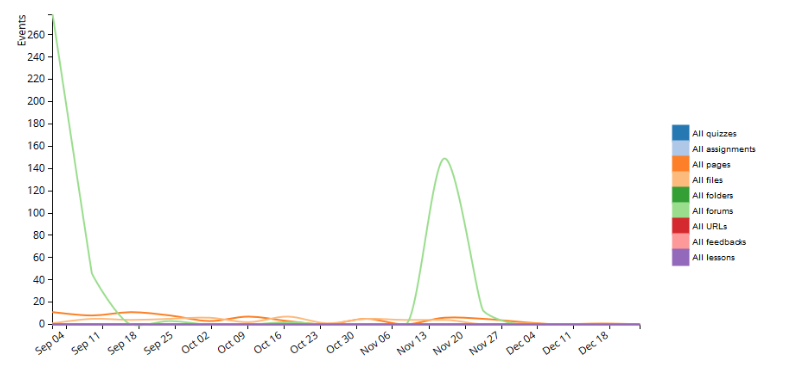
This article describes how instructors can use the Advanced Usage report plugin to discover how specific students are interacting with their eClass course. The example below shows the results from a completed course but the same lessons can be applied to a course that’s currently in progress. Begin by adding a Content Engagement Over Time Advanced Usage report and filtering the report to display a particular student and time range. Click Apply filter to display the graph.
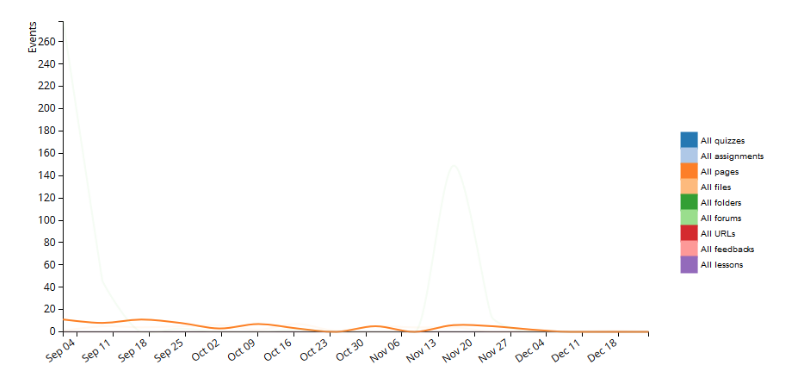
In this student's case, the graph shows access to files and pages at regular intervals through the course, as well as a significant number of forums accesses at two larger intervals in the course. This course had a few weeks that were flipped -- where the face-to-face lecture was replaced by online modules -- requiring students to post in a discussion forum so this is apparent in the data. During the other weeks, students were not required to post in a discussion forum. As it can be challenging to see some of the smaller more regular results 'beneath' the large spikes in forum activity, you can mouseover one of the legend entries to fade out all other lines on the graph except the one you select. The result of this is pictured below (hovering over 'All pages'):
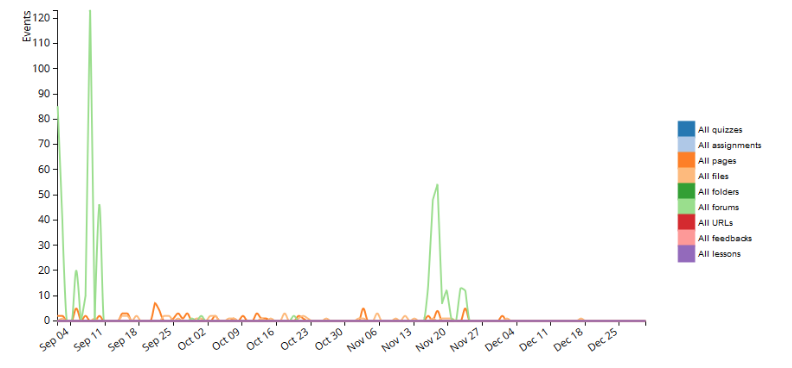
The default view computes only 16 points in time, which amounts to roughly one every week over a four-month period. This shows about one result per week when looking at the graph. To obtain more detailed information about events that occur at specific times, adjust the granularity for the graph under Show advanced. Since the spikes in forum access occur at only specific weeks in the course, to see a bit more information about those setting the granularity to 128 will increase the detail by adding 8 times as many points in time. Here’s what that looks like:
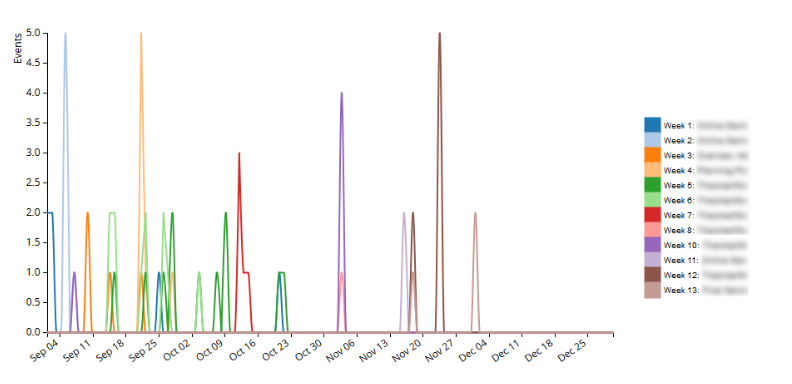
Using 8 times as many points in time means that the graph shows roughly one entry per day. Note, however, that the x-axis remains the same: this is because the overall time period being covered is the same. With better time resolution, it is now possible to see exactly on which days events are occurring, rather than those events being 'lumped together' in time. For this particular student, the graph shows the forum peaks tend to happen in pairs and there are actually 3 such instances in the course (week 1, week 2, and week 11) rather than 2. The sets of two peaks suggest that the student was required to post some initial thoughts and later post a final summary of their learning for the week. You could further clean up the data view and investigate student forum behaviour by showing only those activities, rather than aggregating them together in the graphs above. For example, to see this student's access only to forums, click All forums in the legend to automatically filter the data to only the forum activities in the course. It is also possible to view student behaviour when accessing static content in your course. To do this, the process is similar to filtering to only forums: select All pages in the legend of the initial graph:
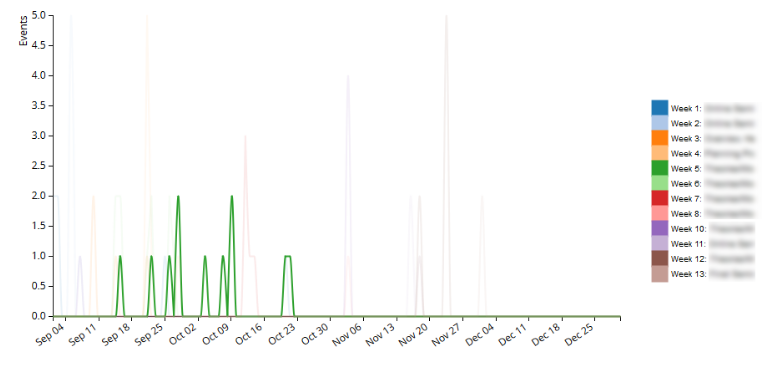
What’s most interesting about this graph is that some of the weekly pages appear at multiple times (the green ones, in particular, seem to be). This shows when the student accessed weekly content in previous or subsequent weeks. Getting a sense of which weeks the student referred to multiple times during the course can help you target changes in focus or structure for future iterations of a course. To see this clearly, mouseover the particular entry on the legend - here’s an image of mouseover for the week 5 entry:
This shows that the student accessed the page well prior to week 5 and also accessed it after week 5. This is quite different from the red entry, which is very well localized in time (just prior to Oct. 16), but it was viewed about 5 times in total.
| |
|
|

Comments (0)